Ballon d’Or Analysis

Background: The Ballon d’Or is an annual award given to the best soccer player in the world, and, as an avid fan, I am invested in the outcome. The 2024 Ballon d’Or race was tough as there were so many great players, but, to me, no player stood out as far-and-away the best player.
Hypothesis: Though no player is far and way the best, Rodri, the Spanish midfielder playing for Manchester City, would win the 2024 Ballon d’Or/
The Analysis: The analysis was conducted in R, utilizing the Shiny and Plotly packages for readable graphs. The study focused on three main areas: Goal contributions, defensive contributions, and overall plus-minus statistics.
Terms to Know:
- Goal Contributions: measures both goals & assists
- Each game is worth 3 points. Teams get 3 points for a win, 1 for a tie, 0 for a loss. The statistic “points won per match” is an average of this statistic throughout the season and represents a teams success
- Plus-Minus: Measures the impact a player has on each game. A higher value means that the team performs better with this player on the field.
- Positions (abbreviated for clarity): FW = forward, MF = midfield, DF = defender, GK = goalkeeper. Note: some players play more than one position.
- Other Notes: there is only one goalkeeper nominated for this award, so it is difficult to compare him to any of the field players. I made the assumption (boldly) that this player would not win, essentially discounting his data
Results: Viewers can customize the display to show specific leagues, and even highlight points on the scatterplot to only display certain players throughout all three graphs. Here is a brief overview of the analysis:
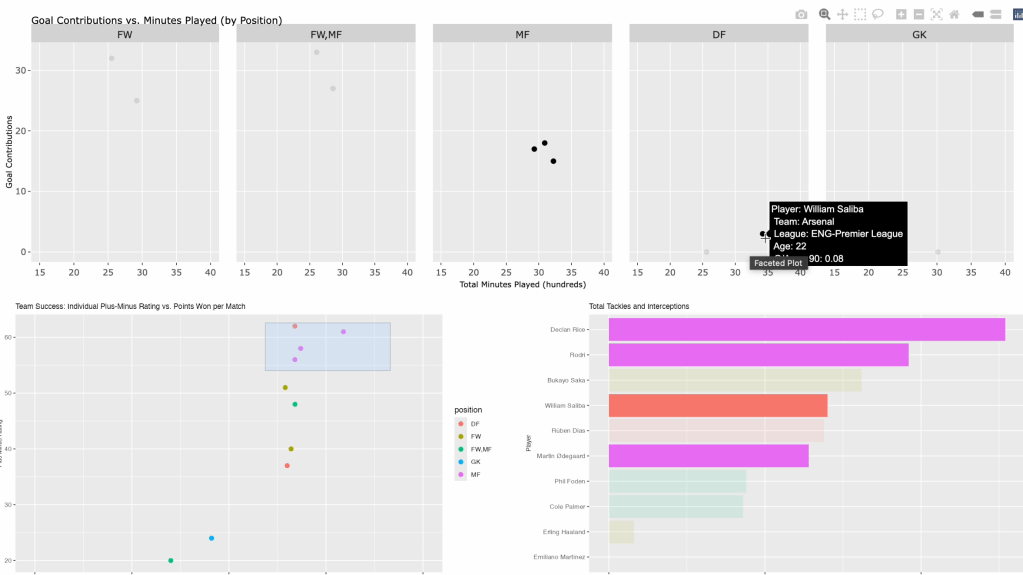
Figure 1: Over view of project. Notice the highlighted points filter the data in the other graphs, making comparisons easy. Also see how the cursor hovers over datapoints, displaying the full profile of the player.

Figure 2: Horizontal bar chart for defensive impact. Displays all players initially, but can be filtered by position, league played in, and selected points (See: Figure 1)
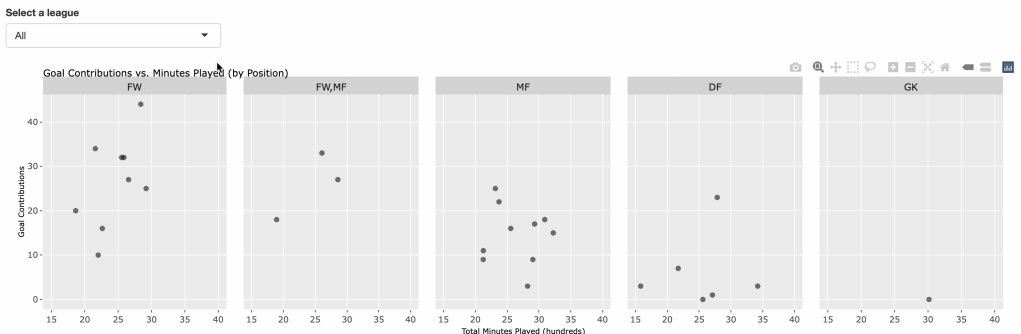
Figure 3: Goal Contributions by position. Users and select points to learn more about each player. They can also highlight points to filter the rest of the data.
Conclusion: After studying these charts, it is clear that Rodri is the best player in the world and therefore deserving of the awards. Those in favor of the second past player (Vinicius Jr., Real Madrid), would point in favor of his higher goal/assist production. However, Rodri’s strongest point support is that he only lost 1 game out of 63 played that year (for club and country). This factor stands out in the study as his plus-minus is the highest, ultimately showing that his impact goes beyond typical statistics.
Want to try for yourself? Visit my GitHub. Enjoy!
