Traffic Analysis of Madison, WI

Background: Traffic in Madison (WI) is hectic, and I have frequently found myself believing that the one-way roads actually make it more difficult for drivers to navigate the city, ultimately causing more traffic. I conducted an in-depth analysis of traffic in Madison, specifically Dane county, to determine how road types and travel direction (for one-way roads) have an impact on the level of traffic stress.
Procedure: The graph was made in R using the Shiny and Plotly packages for interactive subgraphs, making digesting information simple for users of all backgrounds. Uses data provided by the city of Madison.
Key Terms/Legend
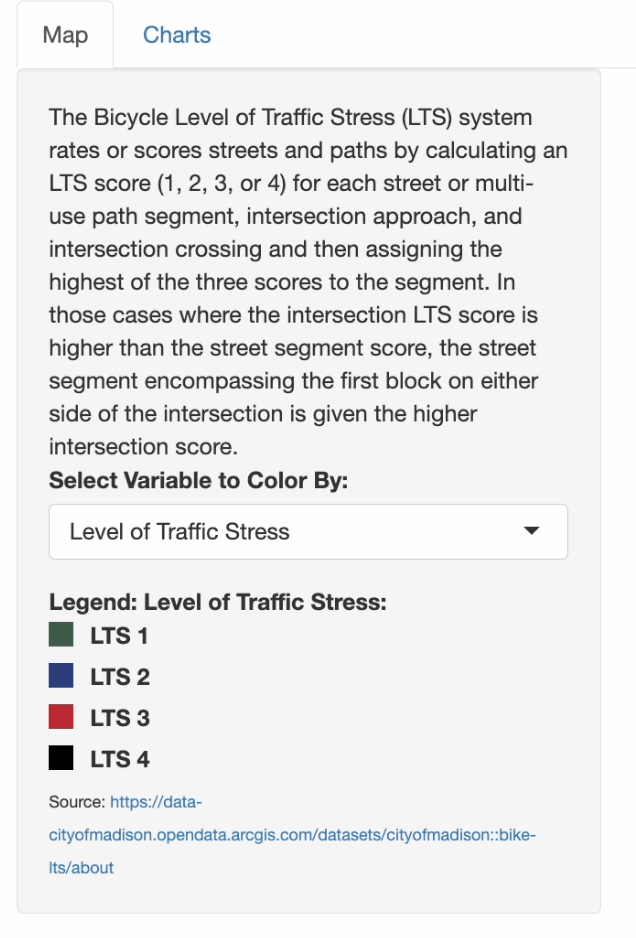
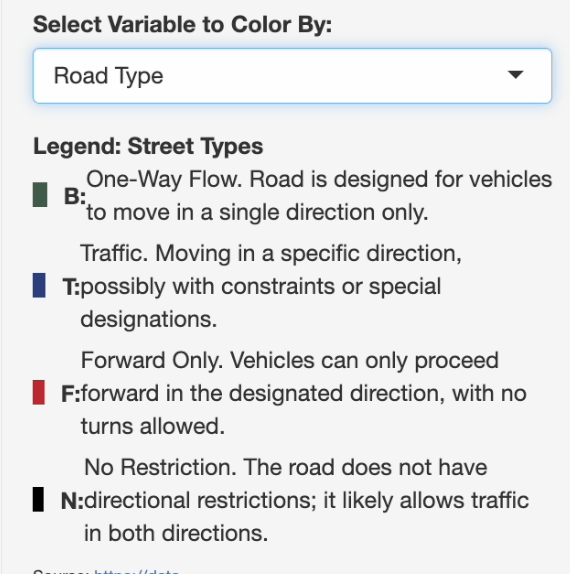
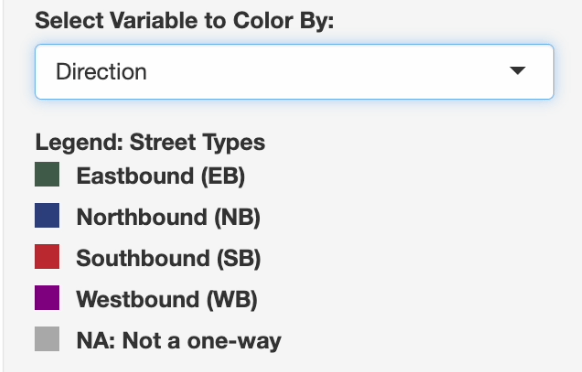
Snippets
Each of the key terms in the legend produced a different map of the city. Users can hover over each street for a popup with each street’s full set of information.
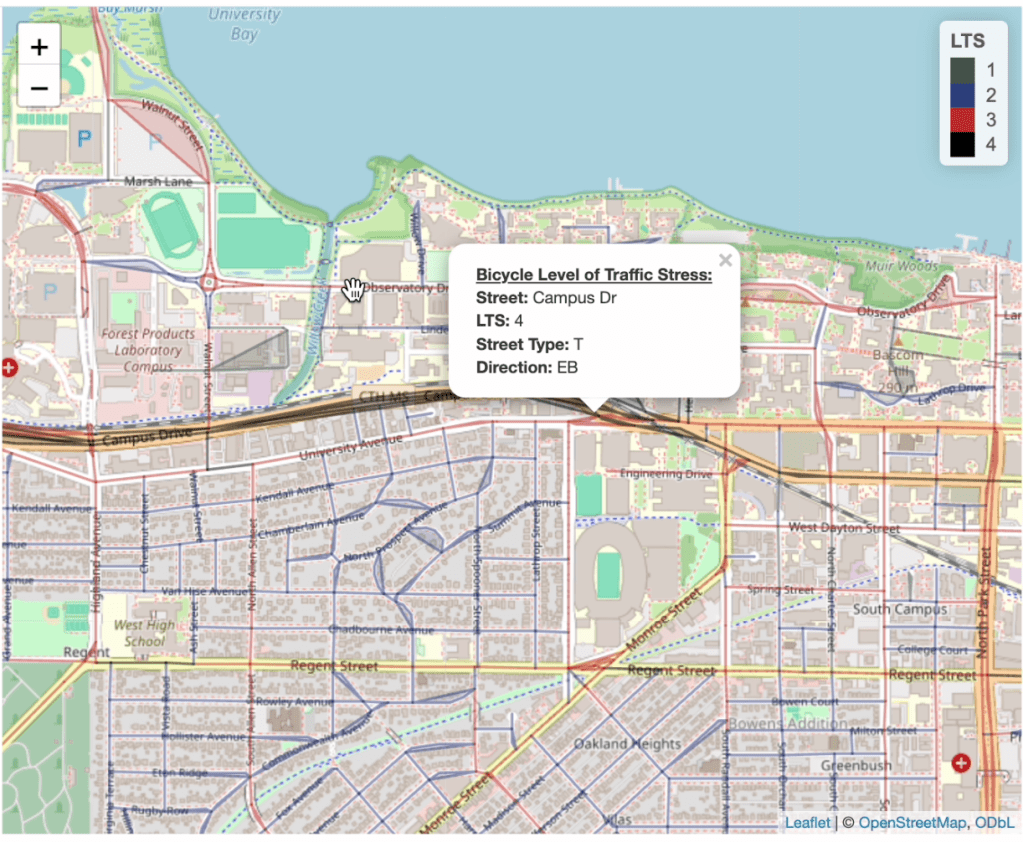
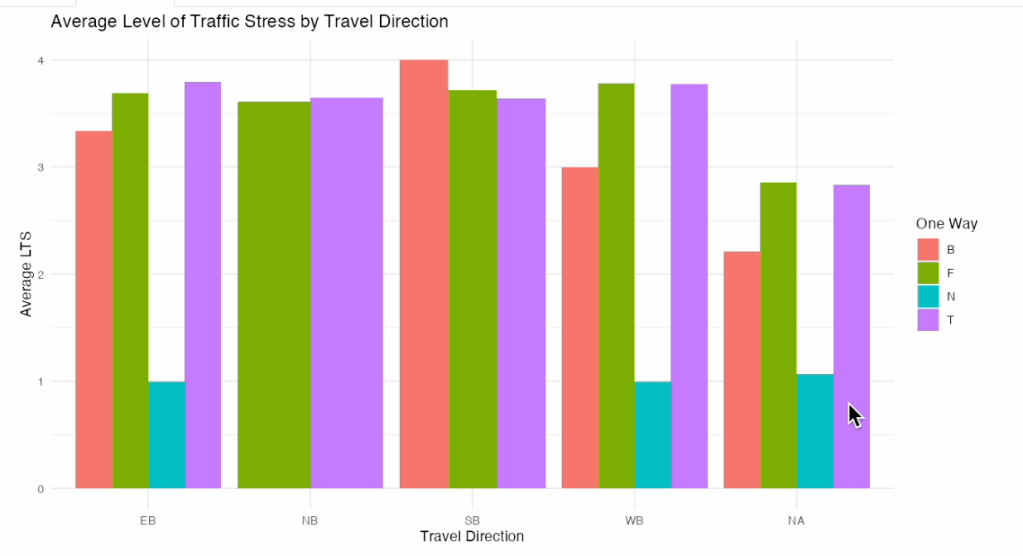
Figure 2 led me to an interesting realization: one-way roads, forward-only roads, and optional roads are really all the same, and the original dataset must have labeled these at different periods. Notice in the bottom graph how the roads with “No Direction” consistently had the lowest average traffic stress. It also appears that travel direction had little impact on traffic stress
